JPMorganChase Integrated Engineers Portal
Streamlining software app space provisioning for 40k+ engineers.
Role
Product Design Intern
Timeline
June - Aug 2025
Team
1 Design Lead
2 Designers
1 Engineer
Tool Kit
Adobe Analytics, Figma, UXR, Lucid, Agile, Jira
01 SUMMARY
Improving the engineer experience with analytics for frictionless operations
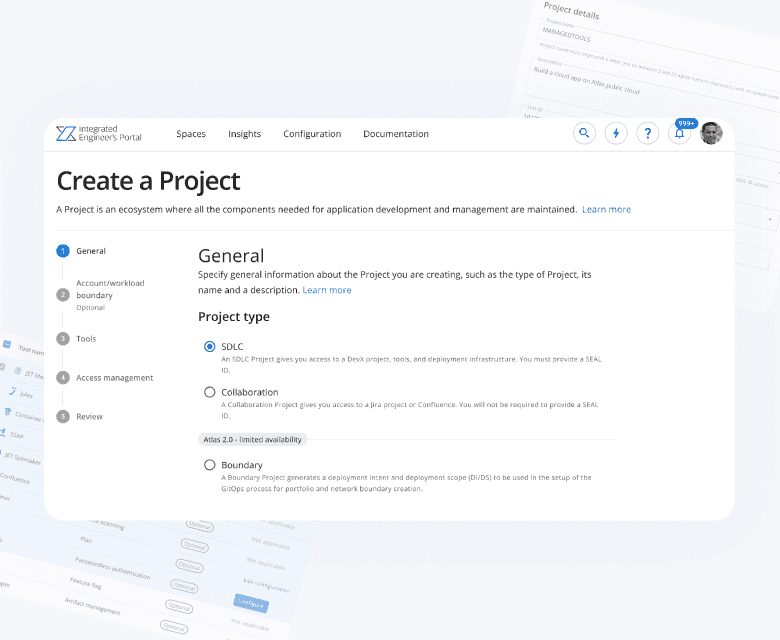
For 10 weeks, I worked at JPMorgan Chase as a Product Design Intern within the Engineer’s Platform & Experience Team. I primarily contributed to the Integrated Engineers Portal (IEP), a central hub that streamlines the software development lifecycle by automating cloud provisioning, centralizing CI/CD pipeline management, and improving application health—used by 40,000 of our engineers. While my work is under NDA, my main contributions included:
For 10 weeks, I worked at JPMorgan Chase as a Product Design Intern within the Engineer’s Platform & Experience Team. I primarily contributed to the Integrated Engineers Portal (IEP), a central hub that streamlines the software development lifecycle by automating cloud provisioning, centralizing CI/CD pipeline management, and improving application health—used by 40,000 of our engineers. While my work is under NDA, my main contributions included:
Created Adobe Analytics dashboards for the Create App Space Wizard feature within the IEP, tracking adoption metrics including a 10.9% submission rate and identifying drop-off rates across 28 screens
Created Adobe Analytics dashboards for the Create App Space Wizard feature within the IEP, tracking adoption metrics including a 10.9% submission rate and identifying drop-off rates across 28 screens
Saved $700,000 annually through Adobe Analytics implementation and advocated for broader adoption by developing engineering telemetry guidelines, dashboard templates, and comprehensive documentation
Saved $700,000 annually through Adobe Analytics implementation and advocated for broader adoption by developing engineering telemetry guidelines, dashboard templates, and comprehensive documentation
Redesigned and improved existing screens by refining components and updating layout documentation based on insights gathered from Adobe Analytics metrics
Redesigned and improved existing screens by refining components and updating layout documentation based on insights gathered from Adobe Analytics metrics
02 TIMELINE & SCOPE

My team worked in agile to enable faster iterations, translating my roadmap into Jira tickets with story points, user stories, and acceptance criteria.
My team worked in agile to enable faster iterations, translating my roadmap into Jira tickets with story points, user stories, and acceptance criteria.

03 TAKEAWAYS
Design goes beyond convention
I once thought design was a simple waterfall process: discover, design, then hand off to developers. But working in an agile scrum alongside engineers to implement analytics showed me how vital ongoing collaboration is. Adding tools like Adobe Analytics not only improves communication between designers, engineers, and project managers but also made me realize tools for designers are constantly growing. With analytics, I was able to speed up iterations, save money, please stakeholders, and keep us competitive.
I once thought design was a simple waterfall process: discover, design, then hand off to developers. But working in an agile scrum alongside engineers to implement analytics showed me how vital ongoing collaboration is. Adding tools like Adobe Analytics not only improves communication between designers, engineers, and project managers but also made me realize tools for designers are constantly growing. With analytics, I was able to speed up iterations, save money, please stakeholders, and keep us competitive.
Embrace ambiguity
If every task were easy, success wouldn’t feel as meaningful. At a company with over 100,000 employees, only a handful had experience with Adobe Analytics, so I was initially intimidated by the challenge of mastering the tool, creating dashboards to drive data-informed improvements, and finally training others. Despite setbacks like inconsistent data and unexpected research obstacles, the independence I gained made the entire experience rewarding.
If every task were easy, success wouldn’t feel as meaningful. At a company with over 100,000 employees, only a handful had experience with Adobe Analytics, so I was initially intimidated by the challenge of mastering the tool, creating dashboards to drive data-informed improvements, and finally training others. Despite setbacks like inconsistent data and unexpected research obstacles, the independence I gained made the entire experience rewarding.
Be a hedgehog.
In a large company, there are countless talented individuals to learn from. Although my primary focus was UX research and data-driven case studies, I seized opportunities to broaden my design skills by redesigning wireframes using the Material UI design system, conducting accessibility audits with iterative recommendations, and researching project management challenges between design and developer handoff.
In a large company, there are countless talented individuals to learn from. Although my primary focus was UX research and data-driven case studies, I seized opportunities to broaden my design skills by redesigning wireframes using the Material UI design system, conducting accessibility audits with iterative recommendations, and researching project management challenges between design and developer handoff.
Any questions? Contact me at dkherrer@uci.edu to see the full case study!
Any questions? Contact me at dkherrer@uci.edu to see the full case study!
Any questions? Contact me at dkherrer@uci.edu to see the full case study!